We are pleased to share with you the key service calls statistics in 2017 to reflect on our work last year.
Service Calls Statistics
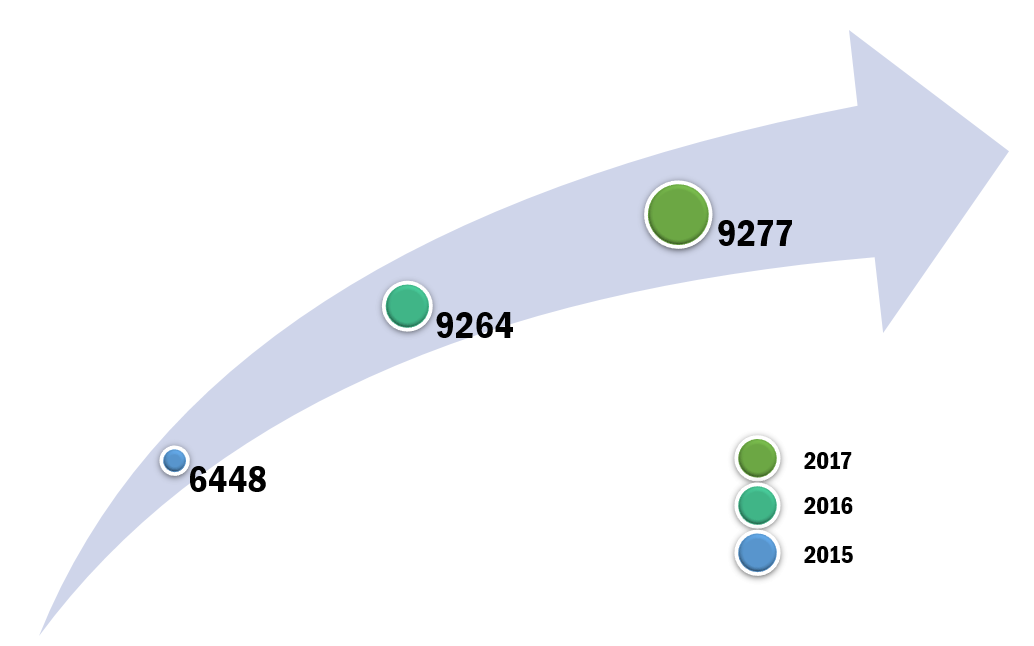
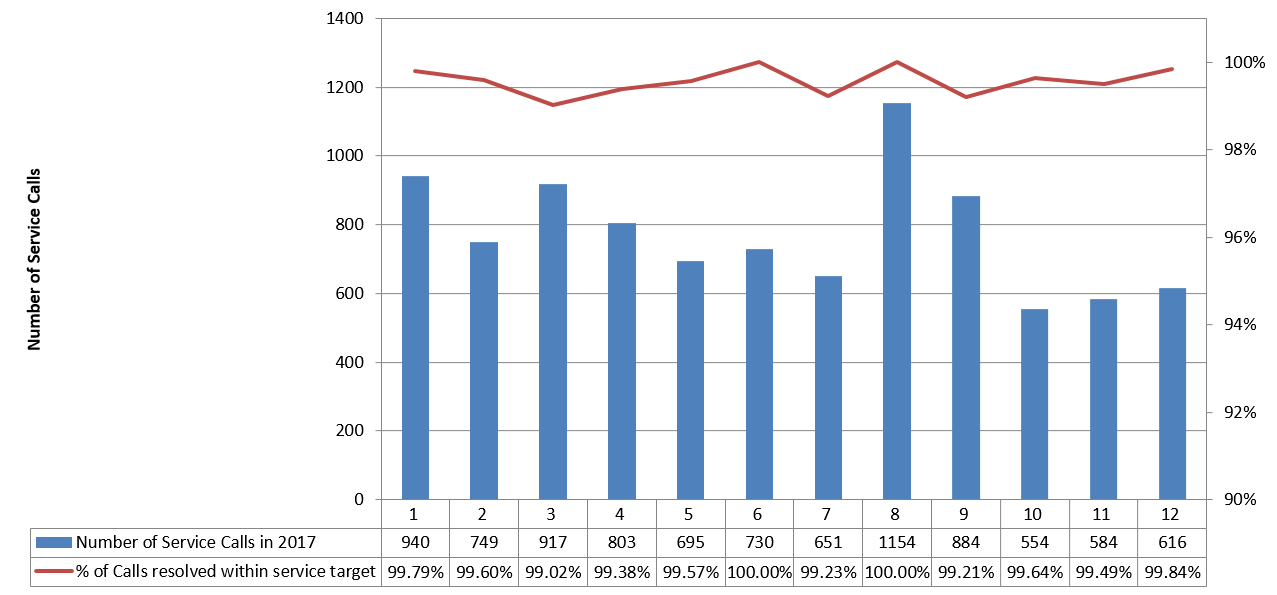
+ Total No. of Service Calls Handled
9, 277 service calls were handled in 2017. The demand for the IT support service slightly increased compared to 2016 (9, 264 service calls).
9, 277 of the service calls, 3,353 were Incident Calls and 5,924 were Request Calls.
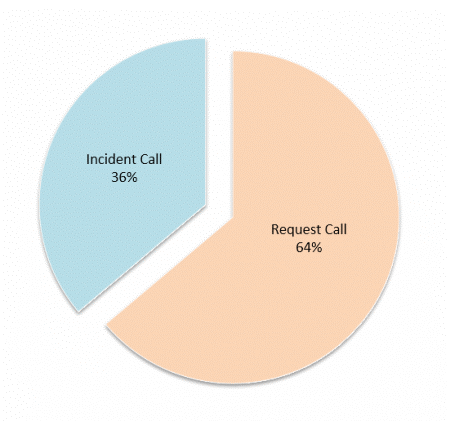
Incident Call refers to the service calls made by users for technical support on resolving problems they encountered.
Request Call refers to other kinds of service requests we provide to users such as new installation of IT equipment for new staff, upgrade of equipment, technical support on activities or seminar held by the University etc.
+ Service Calls Solved within Service Target
99.57% of service calls were solved within service target.
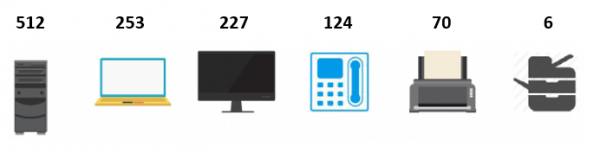
+ No. of Equipment Issued to Staff Members
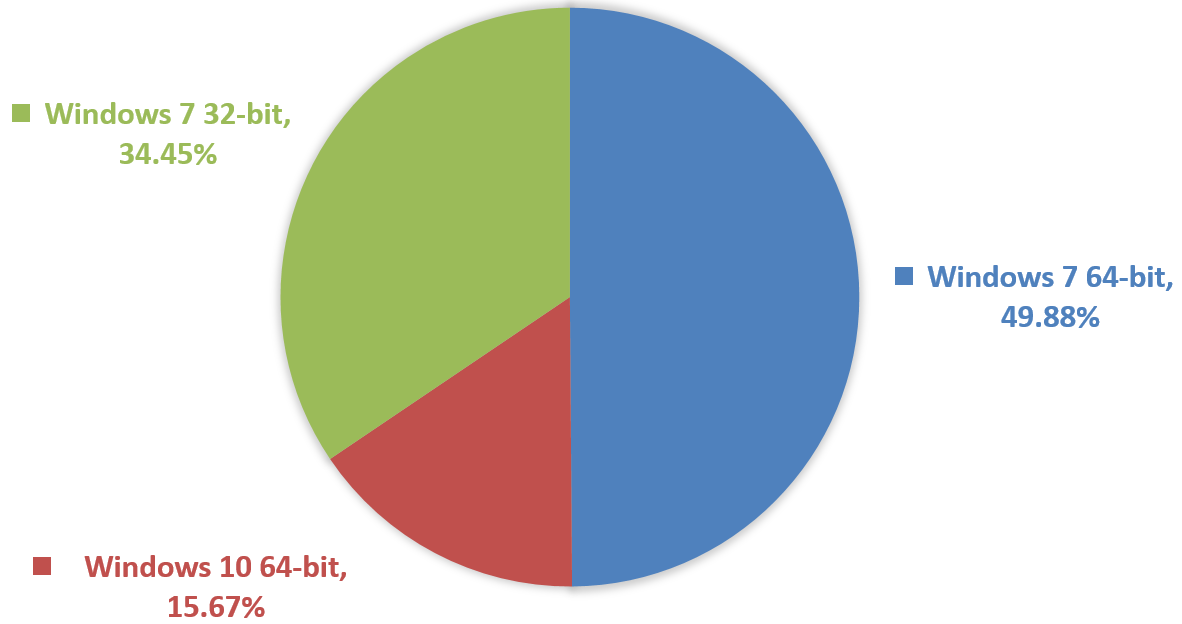
+ Operating System of ICTO Computer
ICTO maintained both 32-bit & 64-bit Windows 7 and 64-bit Windows 10 master images for new models of desktop computers and notebooks to cater the need of users. Around 49.88% of computers were installed with Windows 7 64-bit and 15.67% of computers were installed with Windows 10 64-bit (ICTO had started to deploy new operating system Windows 10 since December 2017)
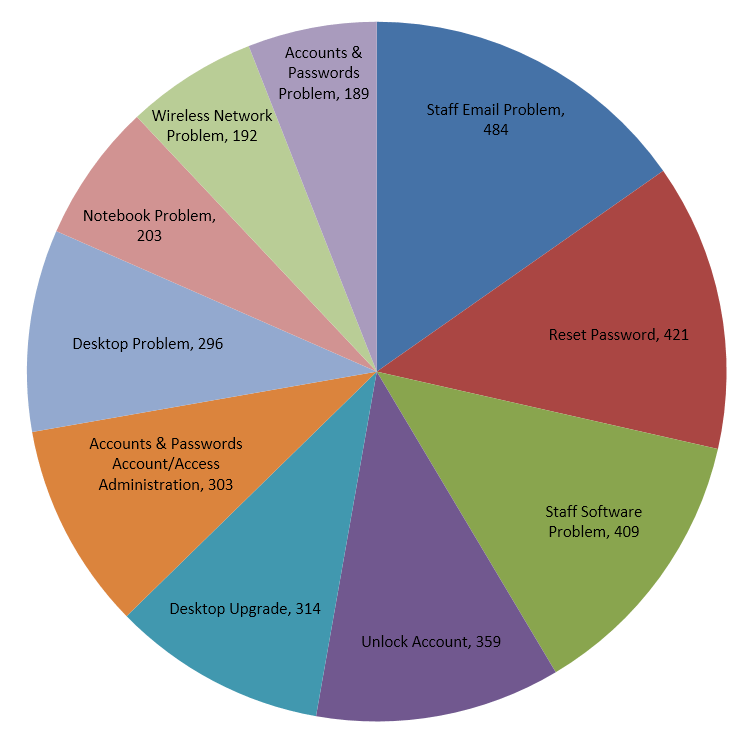
+ Top 10 Service Calls Encountered by Help Desk
Staff email problem counted the most among all service calls.
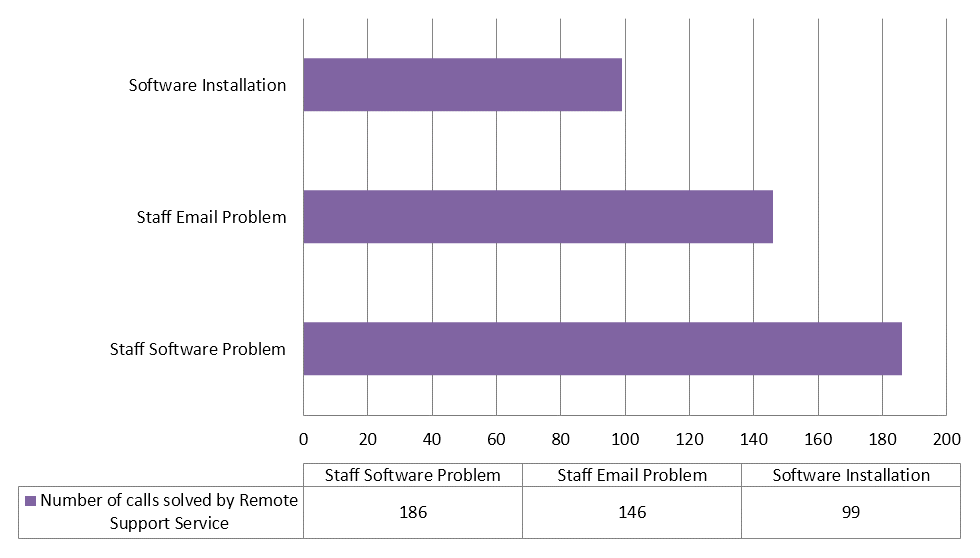
+ Remote Support Service
In 2017, 606 calls were solved by Remote Support Service.
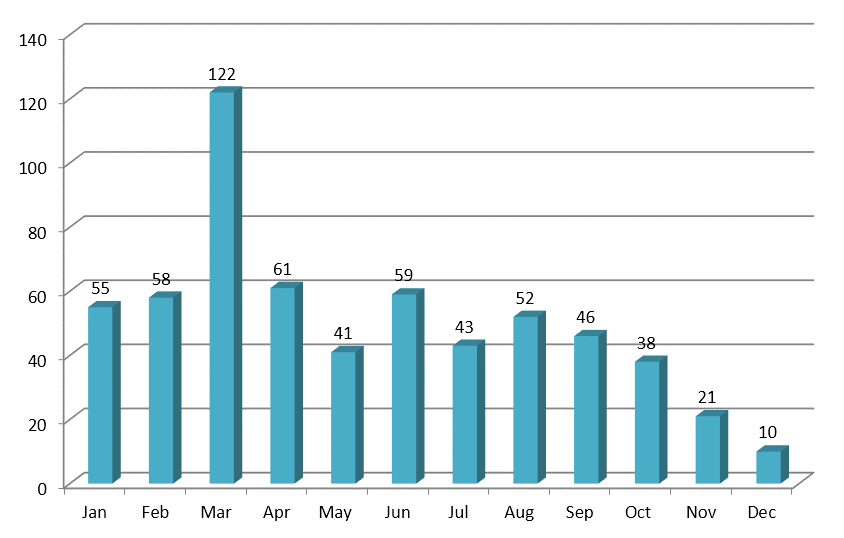
Remote Support Service handled many software problems and email problem, and these two categories already counted more than 55% of all Remote Support calls. Many requests related to installation of software were also handled by Remote Support Service.
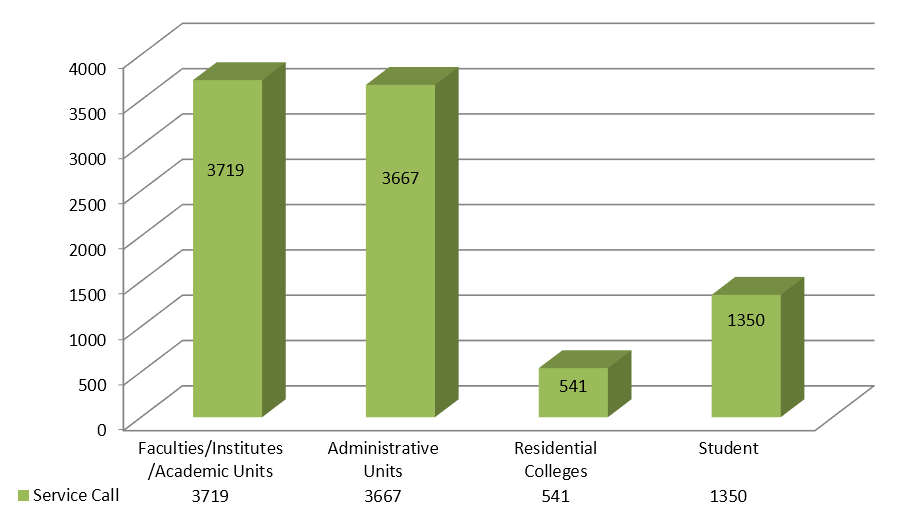
Call Distribution
Among all service calls in 2017, approximately 40.09% of calls were from faculties/institutes/academic units, 39.53% were from administrative units, 5.83% were from residential colleges and the remaining 14.55% were from Students.